The New Economy Uses Your Data As Labor: Here’s How You Own It.
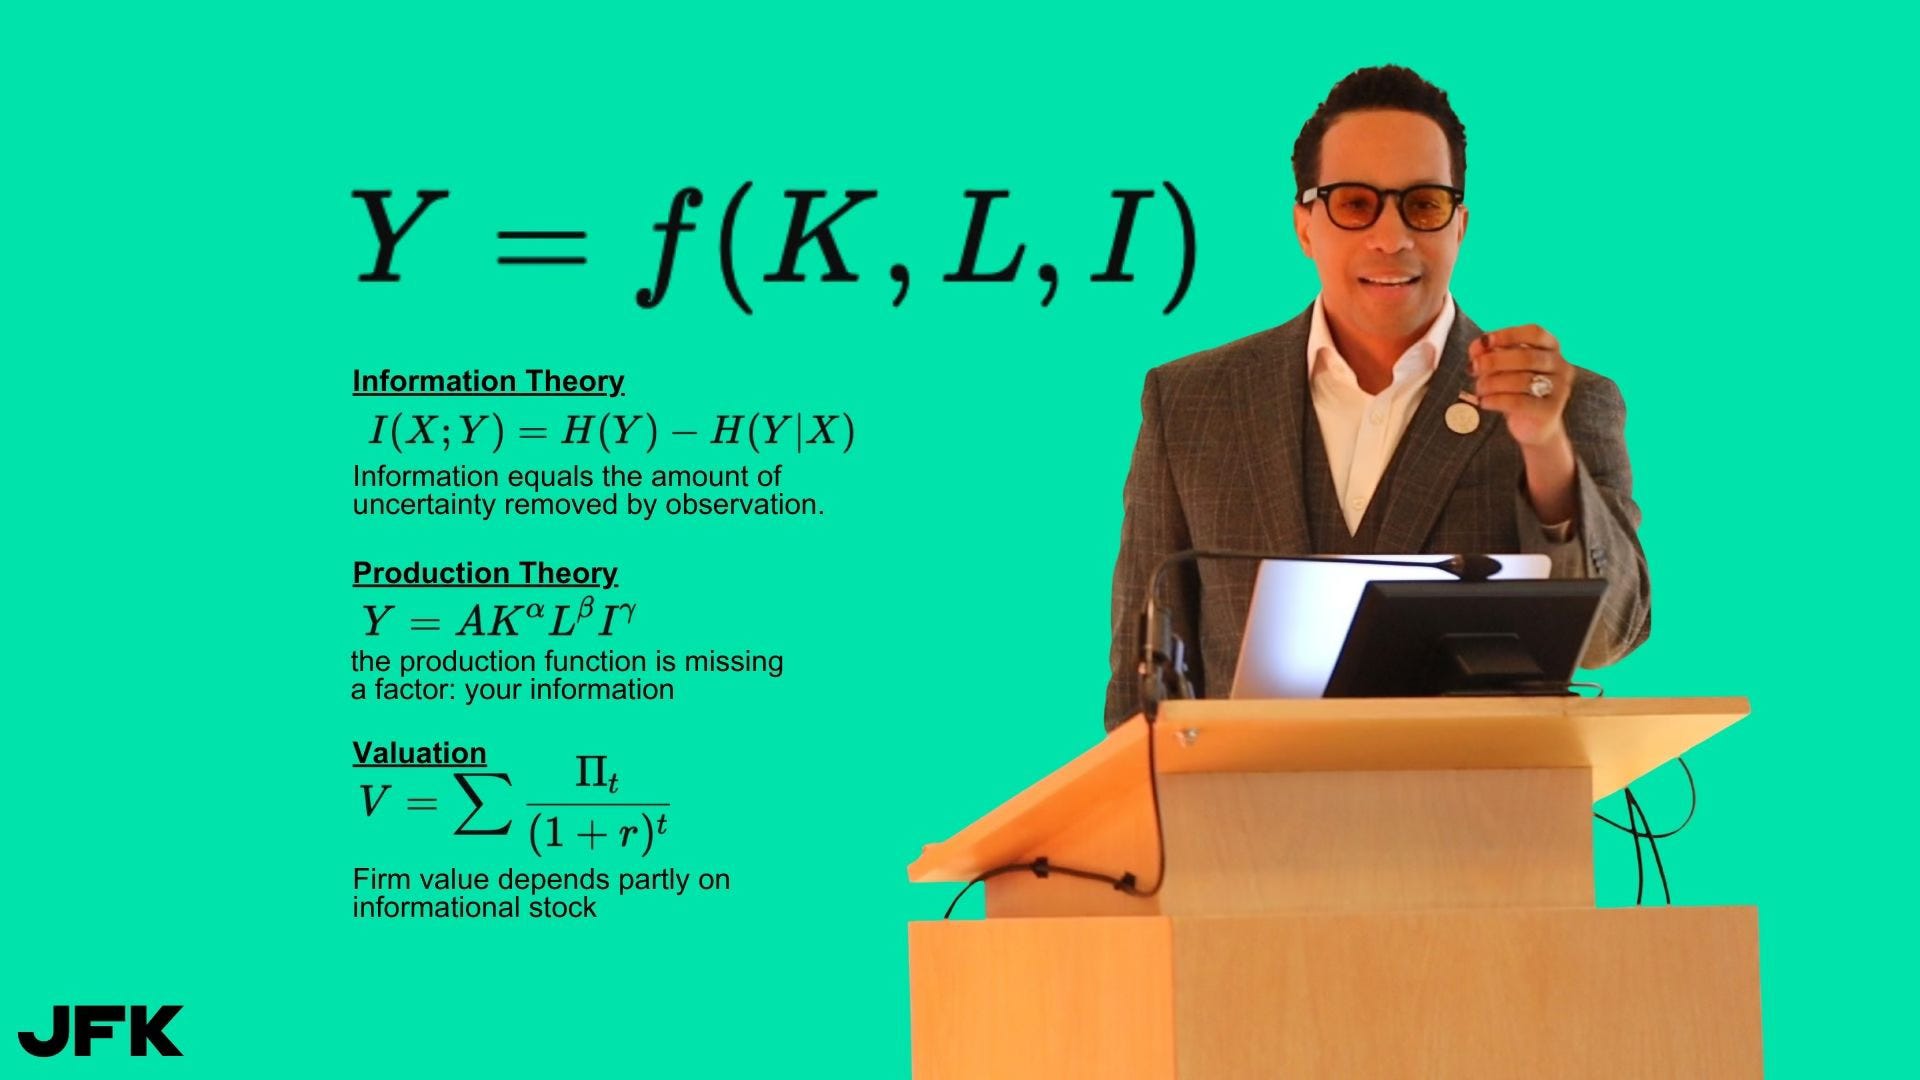
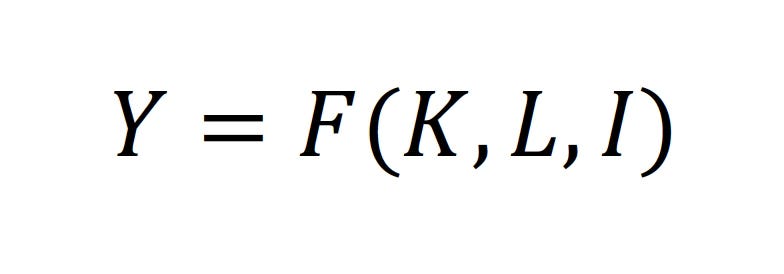
We are solving income inequality for economic exclusion between asset owners and works at the Keith Institute. The problem in the modern economy is not wages, it’s ownership. The article below is not nearly as technical as the economics paper I published yesterday, so let me explain in plain English what the equation "Y equals F of K, L, and I" represents. I am calculating your personal data’s as an input to the economic productivity of every company or product you engage. We have built this into an application to render what I call a Data Cap Table, and it can quantify the value of any system of data. The economics of the 20th Century only considered capital and labor. This new one considers data you input as your property.
Output (Y) is a function of capital (K), labor (L), and inputs (I).
Why Every Company Has a Hidden Data Cap Table
For more than a century, we have understood companies through a simple idea: a cap table. A capitalization table shows who owns what share of a company—founders, investors, employees. It is the ledger of value distribution.
But modern companies are increasingly built on something that never appears in that ledger: data generated by human activity.
Every interaction with a product—every purchase, search query, route taken, or support ticket filed—creates observations. Those observations reduce uncertainty about future behavior. When uncertainty falls, predictions improve. When predictions improve, decisions become more efficient. Efficiency translates into productivity, and productivity into economic value.
The strange thing about the modern economy is that we measure the value produced by these systems, but we rarely measure the inputs that made them possible.
In practice, every data-driven company already operates with what could be called a hidden Data Cap Table.
The Invisible Input Behind Modern Production
Traditional economic models describe production as a combination of capital and labor. Machines, buildings, and infrastructure represent capital. Human effort represents labor. Together they produce goods and services.
But in a world of predictive systems and artificial intelligence, there is a third input: information.
Information arises when observations reduce uncertainty about outcomes. When a retailer predicts demand more accurately, it can stock the right inventory. When a logistics network predicts delivery times, it can route vehicles more efficiently. When a mobility platform predicts where riders will appear, it can position drivers in advance.
Each of these improvements comes from observations generated by people interacting with systems.
Those observations accumulate into informational stock—predictive knowledge about the world.
Companies rarely record this stock as an asset. Yet they build entire business models around it.
From Human Activity to Economic Value
The chain is simple once you see it.
Human activity generates data.
Data reduces uncertainty.
Reduced uncertainty improves predictions.
Better predictions improve decisions.
Better decisions increase output.
At the end of that chain is revenue, profit, and ultimately firm value.
Financial markets already recognize the outcome. The majority of the value of large public companies now resides in intangible assets rather than physical capital. Investors understand that something beyond machines and labor is creating productivity.
But the accounting system stops short of identifying what that “something” actually is.
In reality, much of that value is derived from observational data created by people using the system.
The Hidden Ledger
Imagine a retailer with millions of customers. Each purchase teaches the company something about demand patterns, pricing sensitivity, and product preferences. Over time, the retailer’s predictive systems become more accurate.
Now imagine listing the sources of those insights:
purchase history
browsing behavior
location data
seasonal demand patterns
customer feedback
Each of these inputs improves the company’s ability to predict outcomes.
If we measured their contribution to predictive performance, we could estimate how much each source reduces uncertainty—and how much economic value that reduction produces.
That ledger would look surprisingly familiar. It would resemble a cap table.
Instead of listing shareholders, it would list informational contributors.
Instead of listing equity shares, it would list contributions to predictive power.
This is the hidden Data Cap Table that already exists inside every data-driven firm.
Why Companies Have Not Measured It
For most of industrial history, information played a relatively small role in production. Manufacturing output depended mainly on physical inputs and labor.
Today, however, companies rely on predictive systems to coordinate enormous networks of activity. Demand forecasting, fraud detection, route optimization, recommendation engines—these systems all depend on data generated through human interaction.
Yet the tools for measuring the value of informational inputs have lagged behind the technology that uses them.
Companies track model accuracy. They track revenue. But they rarely track which data generated the improvement or how much value that improvement produced.
Without measurement, informational inputs appear to be free.
And when an input appears free, its value is usually attributed to something else.
The Capital Illusion
This leads to an odd phenomenon in modern markets.
Firms that rely heavily on data often appear extraordinarily productive relative to their physical assets. Capital seems to generate unusually high returns. Market valuations soar even when the balance sheet shows relatively little tangible capital.
One explanation is that we are observing a measurement problem.
If informational inputs are not recorded as factors of production, their productivity will appear to come from capital. In effect, informational value becomes embedded in capital returns.
The result is the illusion that machines and infrastructure are producing far more value than they actually are.
In reality, much of that productivity comes from observational data generated by people interacting with the system.
The Emergence of the Data Cap Table
Once companies begin measuring informational contributions, the structure becomes clear.
Every data-driven firm contains multiple sources of informational input:
customers
users
workers
sensors and operational systems
external datasets
internal knowledge bases
Each contributes observations that reduce uncertainty about future outcomes.
When predictive models improve, the value created by those improvements can be attributed back to the data that enabled them.
That attribution forms a Data Cap Table.
It shows which datasets or contributors generated the predictive insights that increased productivity.
Why This Matters
Recognizing the Data Cap Table changes how we think about modern production.
First, it clarifies the role of information as a factor of production. Information is not merely a by-product of economic activity. It is an input that increases the productivity of capital and labor.
Second, it helps explain the rise of intangible value in financial markets. If information drives productivity, then firms that accumulate large informational stocks will appear far more valuable than their physical assets alone would suggest.
Third, it creates the possibility of measuring informational contributions directly. Once companies can quantify which data improves predictions—and how much value those improvements generate—they can make better decisions about data acquisition, governance, and investment.
The Next Layer of Economic Infrastructure
In the early days of industrial capitalism, firms gradually developed accounting systems that tracked capital investment and labor costs. These systems allowed companies to measure productivity and allocate value across inputs.
Today’s economy may be approaching a similar transition.
As predictive systems become central to production, companies will need tools that measure the value created by information itself.
Those tools will reveal something that has been hidden in plain sight.
Every company that relies on data already operates with a cap table of informational contributors. The only difference is that the ledger has not yet been written down.
When it finally is, the structure of modern production will look very different from the one we inherited from the industrial era.